Boosting Customer Loyalty with customer engagement metrics: A Practical Guide
Think of customer engagement metrics as the vital signs of your customer relationships. They’re the hard data points that tell you exactly how, when and how often your customers are interacting with your business. This goes way beyond a simple satisfaction score-it reveals the true health and strength of their connection to your brand.
Why Customer Engagement Metrics Matter More Than Ever

Think your support team as doctors and your customers as patients. You wouldn’t judge a patient’s overall health just by taking their temperature, right? You’d also check their blood pressure, listen to their heart rate and ask about their symptoms. In the same way, relying on a single metric gives you a dangerously incomplete picture of your customer relationships.
Keeping an eye on a handful of key customer engagement metrics is the modern equivalent of a full health check-up. It lets you spot problems before they become critical, get a feel for what customers might do next, and ultimately build a much stronger, more loyal customer base.
Moving from Reactive to Proactive Support
Traditionally, support teams were firefighters, always in reactive mode, waiting for the next problem to flare up. The move toward tracking engagement metrics marks a huge strategic shift. You’re no longer just putting out fires; you’re actively managing the entire customer journey to prevent them from starting.
This data-first approach lets you:
- Predict Churn: A customer’s activity suddenly drops off, or they leave a string of low satisfaction scores. These are early warning signs they might be heading for the exit. Watching these trends lets you step in before it’s too late.
- Foster Deep Loyalty: When you understand what truly makes your customers happy-like getting their issue fixed on the very first try-you can double down on those winning plays. This is how you turn satisfied customers into your biggest fans.
- Identify Friction Points: Are customers constantly asking the same question? Is one particular feature blowing up your ticket queue? These metrics shine a spotlight on the exact pain points in your product or service that need attention.
Tracking customer engagement isn’t about micromanaging your team or chasing vanity numbers. It’s a strategic tool for understanding customer behaviour, pinpointing experience gaps, and creating a support culture that actively builds loyalty.
The Power of Automated Insights
Trying to collect and analyze all this data by hand is a non-starter. Modern helpdesk platforms like Ticketdesk AI are designed to automate this entire process. They pull in the raw numbers from every single interaction and turn them into clear, actionable insights on a dashboard you can actually use.
For instance, a platform can automatically calculate your team’s First Contact Resolution rate and instantly show you how it correlates with your Customer Satisfaction scores. This tells you immediately if resolving tickets faster is actually making customers happier, or if your team needs to slow down and focus more on quality.
This kind of real-time feedback loop gives any support team, no matter the size, the power to make smarter decisions that have a direct impact on growth and keeping customers around for the long haul.
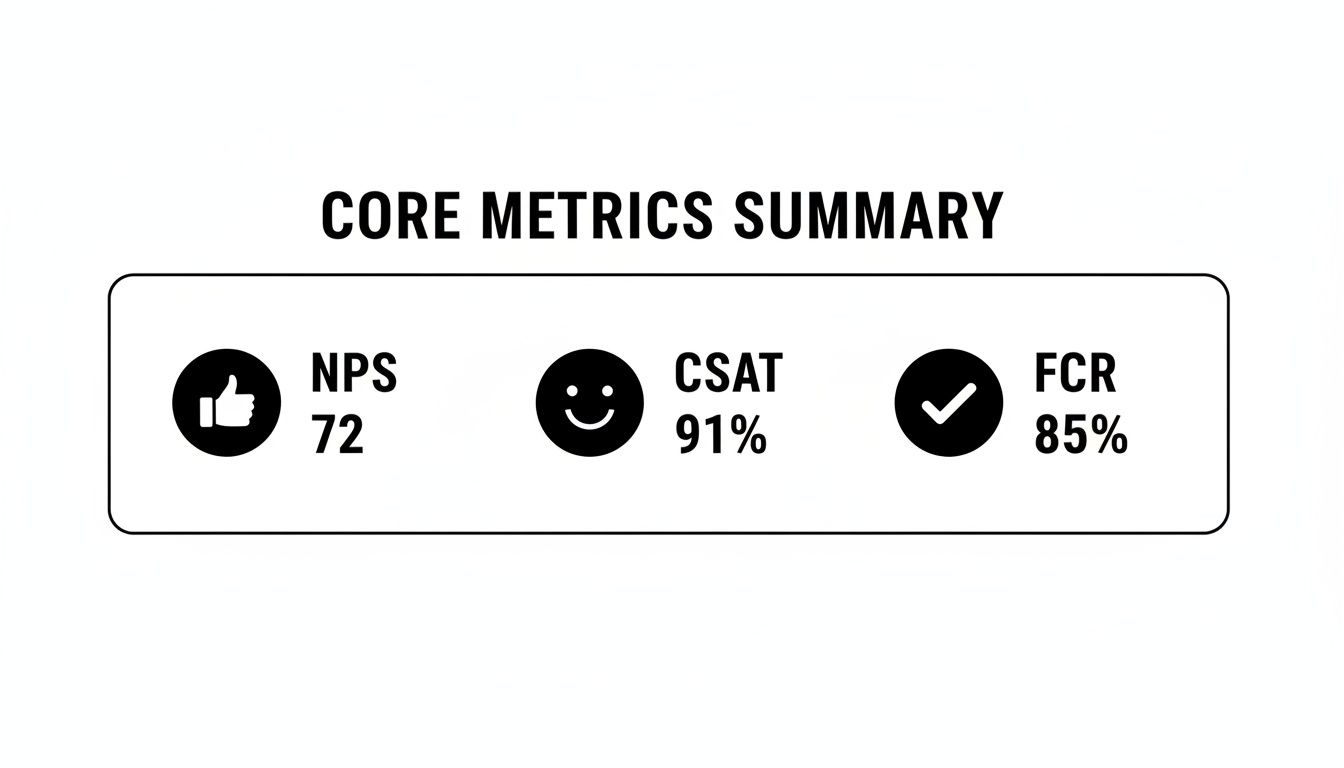
The Four Core Metrics Your Support Team Must Track
While you could track dozens of different data points, a handful of core customer engagement metrics really act as the North Star for any support team. These aren’t just numbers to fill up a dashboard; they’re direct signals of customer loyalty, how efficiently your team is working, and the overall health of your brand. Getting a handle on them is the first step to building a support strategy that’s actually informed by data.
Let’s break down the essential four: Net Promoter Score (NPS), Customer Satisfaction (CSAT), First Contact Resolution (FCR), and Average Handle Time (AHT). Each one gives you a unique window into your customer experience.
Before we dive into the details, here’s a quick overview of these foundational metrics. Think of this table as your cheat sheet for understanding what each one tells you and why it’s so important.
Core Customer Engagement Metrics at a Glance
| Metric | What It Measures | Calculation | Why It Matters |
|---|---|---|---|
| NPS | Overall customer loyalty and likelihood to recommend your brand. | % Promoters - % Detractors | Predicts long-term growth and identifies brand advocates vs. at-risk customers. |
| CSAT | Immediate satisfaction with a specific support interaction. | (% of Satisfied Customers / Total Responses) x 100 | Provides direct, real-time feedback on agent performance and issue resolution. |
| FCR | The percentage of issues resolved in the first contact. | (Total Resolved Cases in First Contact / Total Cases) x 100 | Directly links operational efficiency with customer happiness. A high FCR is a win-win. |
| AHT | The average time it takes to handle a single support interaction. | (Total Talk/Chat Time + Hold Time + Follow-up Work) / Total Cases | Measures agent efficiency, but must be balanced with quality metrics like CSAT and FCR. |
Now that you have a high-level view, let’s get into what makes each of these metrics tick and how you can start using them to your advantage.
Net Promoter Score (NPS) The Loyalty Predictor
Think of NPS as a check-up on your long-term relationship with customers. It isn’t about a single ticket or interaction. Instead, it asks one simple but powerful question: “On a scale of 0-10, how likely are you to recommend our company to a friend or colleague?”
Based on their answers, customers fall into three buckets:
- Promoters (9-10): These are your champions. They’re loyal, they’ll buy again, and they’ll refer others, which is pure gold for growth.
- Passives (7-8): They’re satisfied enough, but not blown away. These customers are often on the fence and can easily be swayed by a competitor.
- Detractors (0-6): These are unhappy customers. They can actively hurt your brand with negative word-of-mouth and slow down your growth.
The formula is straightforward: NPS = % of Promoters - % of Detractors. A high score is a powerful signal of strong customer loyalty and a great predictor of future growth. In fact, companies with an NPS above 50 often see a 20-30% higher customer lifetime value (CLV) over three years.
We’ve seen users on Ticketdesk AI boost their NPS by up to 25 points in a single quarter. How? By letting AI handle routine queries 24/7, their agents are freed up to focus on the high-value conversations that build real relationships.
Customer Satisfaction (CSAT) The In-the-Moment Snapshot
While NPS gives you the big picture, CSAT zooms in on a specific interaction. It’s that classic “How would you rate your experience today?” survey, usually sent right after a support ticket is closed. It gives you immediate, transactional feedback on how well an agent performed and whether the solution actually worked.
CSAT is typically measured on a 1-5 scale. The score is calculated by taking the number of happy customers (those who rated 4 or 5) and dividing it by the total number of people who responded.
CSAT Score = (Number of Satisfied Customers / Total Number of Survey Responses) x 100
A high CSAT score tells you the team is solving problems in a way that leaves customers feeling good. It’s a fantastic metric for coaching agents and spotting friction points in your support process. If you want a quick baseline, you can use our simple customer satisfaction calculator to see where you stand.
First Contact Resolution (FCR) The Efficiency and Happiness Metric
You could argue that First Contact Resolution (FCR) is one of the most important metrics out there because it measures efficiency and customer satisfaction at the same time. It simply tracks the percentage of support requests that are completely solved in the very first interaction, with no need for a follow-up.
A high FCR means two great things are happening: your customers are getting their problems solved quickly and without hassle, and your team is working efficiently. When customers don’t have to call back or reopen a ticket, their satisfaction goes way up. Improving this one metric can create a positive ripple effect across your entire support operation.
Average Handle Time (AHT) The Balancing Act
Average Handle Time (AHT) measures the average length of a single support interaction, from the moment a customer gets in touch until the issue is totally resolved. This includes everything-talk time, hold time, and any after-call work an agent needs to do.
But AHT is a metric you have to handle with care. It’s tempting to push for a lower AHT to show efficiency, but if agents are rushing, it can lead to sloppy work, unresolved issues, and unhappy customers. The goal isn’t just to be fast; it’s to be fast and effective. When you’re looking at your numbers, it’s crucial to understand the true digital marketing performance metrics that move the needle for the business, not just vanity stats like speed.
The best approach is to watch AHT alongside CSAT and FCR. If AHT is dropping while your satisfaction and resolution rates stay high (or even improve), you’ve hit the sweet spot. That’s a genuine efficiency gain. Ticketdesk AI helps teams find this balance by giving agents AI-powered reply suggestions and instant access to the knowledge base, cutting down handle time without ever sacrificing quality.
Once you’ve got a handle on the big four metrics, you’re building a solid foundation. But to really level up your support game, you need to dig a little deeper. Advanced customer engagement metrics give you a much more detailed picture of what’s happening, both inside your team and for your customers. They’re the difference between just measuring performance and actually improving it.
Think of it like this: the core metrics are your car’s speedometer and fuel gauge. They’re essential, but they don’t tell you everything. These advanced metrics are like the diagnostic tool that checks your engine health, tire pressure, and electrical systems. They spot the small problems before they turn into major breakdowns.
The foundational scores we’ve covered are the perfect launchpad for these more advanced measurements.
Real insight comes from connecting these high-level numbers to the nitty-gritty operational data. Let’s break down a few.
Customer Effort Score (CES)
Plain and simple: how easy is it for customers to get help from you? The Customer Effort Score (CES) answers that exact question. It measures how much work someone has to put in to get an issue solved, make a purchase, or just find an answer.
After an interaction, you just ask something like, “How easy was it to resolve your issue today?” Customers usually pick from a scale of “Very Difficult” to “Very Easy.” It turns out that making things easy is a huge driver of loyalty. In fact, research shows that 96% of customers who have a high-effort experience become disloyal, compared to just 9% of those with low-effort experiences.
A low Customer Effort Score is a direct indicator of friction in your customer journey. Prioritizing a seamless, low-effort experience is one of the most effective ways to boost retention and customer satisfaction.
Ticket Backlog and Its Hidden Insights
For years, everyone saw a ticket backlog as a sign of failure-just a pile of work the team couldn’t get to. It’s much more productive to see it as a key indicator of your team’s capacity and where your processes might be getting stuck. A backlog that keeps growing isn’t just a sign that your team is busy; it’s a signal that demand is outpacing your ability to solve problems.
Watching your ticket backlog helps you:
- Forecast Staffing Needs: If the backlog is steadily climbing for weeks, that’s a clear sign you might need to hire more agents.
- Identify Process Bottlenecks: Is the backlog piling up in one specific area, like billing questions or technical bugs? That tells you exactly where you need to improve your resources or processes.
- Measure the Impact of Changes: When you roll out a new tool like Ticketdesk AI or update your knowledge base, you should see the backlog start to shrink. If it doesn’t, something’s not working.
Resolution Rate: The Ultimate Measure of Effectiveness
While First Contact Resolution (FCR) is a great metric, Resolution Rate gives you a broader look at how effective your team is overall. This metric simply tracks the percentage of all incoming tickets that actually get solved, no matter how many replies it takes.
Resolution Rate = (Total Solved Tickets / Total Tickets Received) x 100
A high resolution rate, ideally over 95%, means your team is genuinely solving problems, not just closing tickets to clear a queue. If that number starts to drop, it’s a major red flag that issues are falling through the cracks, leaving you with frustrated customers and repeat tickets that burn out your team. For a deeper look at how this connects to long-term success, exploring a full range of customer retention metrics can be incredibly valuable.
Agent Utilization: Managing Your Most Valuable Resource
Finally, Agent Utilization measures how much of an agent’s paid time is actually spent on customer-facing work versus being idle or doing admin tasks. It’s a critical metric for managing your team without causing burnout.
A super-high utilization rate might look efficient on a spreadsheet, but it can be a warning sign of an overworked team with no time left for training, breaks, or handling a sudden rush of tickets. On the other hand, a low rate suggests you might be overstaffed or have clunky workflows.
The goal is to find that healthy balance. This is another area where platforms like Ticketdesk AI can make a huge difference by automating repetitive tasks. This frees up your agents to focus their active time on solving the complex problems where they add the most value. By tracking these advanced customer engagement metrics, you’re not just putting out today’s fires-you’re building a smarter, more resilient support operation for the long haul.
How to Build an Actionable Support Dashboard
Collecting metrics is the easy part. The real challenge is turning all that data into a clear, visual story that your team can actually use. A well-designed dashboard is your support team’s command center, translating raw numbers into insights that drive better decisions every single day. Without one, you’re just flying blind.
The goal isn’t to cram every metric you can think of onto one screen. That just creates noise. A truly effective dashboard tells a story by showing you what’s important right now versus what’s important for the long haul.
It’s all about separating the urgent “what’s on fire?” data from the “how are we trending?” data. This prevents overload and helps everyone, from agents to managers, understand performance at a single glance. Think of it like a car’s dashboard: you’re constantly checking your speedometer, but you only glance at the odometer every so often.
Structuring Your Dashboard for Clarity
A proven way to lay out a support dashboard is to group metrics by how often you need to look at them. This creates a natural flow, pulling your team’s attention from immediate fires to bigger strategic goals.
You’ll want to give the most prominent space to your real-time, daily metrics. These are the vital signs of your support operation.
Daily Pulse Metrics (Real-Time View):
- Active Tickets: How many conversations are open right now? This is your team’s immediate workload.
- New Tickets Today: What’s the incoming volume look like? This helps you shift agents around as needed.
- Tickets Nearing SLA Breach: Which tickets need attention immediately to meet our promises to customers? This is your priority queue.
- First Response Time (Today): How fast are we getting back to people today?
These numbers give you an instant snapshot of the day’s health. They answer one simple question: “Are we on track, or is something about to break?”
Next, set aside sections for metrics that show weekly patterns. These help you spot trends and understand your team’s performance without getting lost in the day-to-day noise.
A great dashboard doesn’t just show you data; it answers critical questions. It should instantly tell you if your customers are happy, if your team is efficient, and where your processes might be breaking down.
Monitoring Weekly and Monthly Trends
While daily metrics are for in-the-moment action, weekly and monthly views are for strategic thinking. They help you measure performance over time and see if the changes you’re making are actually working.
Weekly Performance Metrics:
- CSAT Score (Last 7 Days): How has customer satisfaction been trending this week?
- First Contact Resolution (FCR) Rate: How often are we solving issues on the very first try?
- Average Handle Time (AHT) by Agent: Where are the coaching opportunities? Who’s being super efficient?
Here’s an example of what a clean, modern analytics dashboard can look like, showing you key trends over a specific period.
With a view like this, it’s easy to see if a dip in CSAT lines up with a sudden spike in ticket volume, giving you powerful context for your team meetings.
Finally, your monthly metrics give you that high-level, strategic view. These are the numbers you’ll want to share with leadership to show the support team’s value to the business.
Monthly Strategic Metrics:
- Net Promoter Score (NPS) Trend: Over the long term, are our customers becoming more loyal?
- Ticket Backlog Trend: Is our backlog growing, shrinking, or staying stable month-over-month?
- Resolution Rate by Category: What kinds of problems are we amazing at solving? And where are we struggling?
Platforms like Ticketdesk AI give you customizable, real-time analytics dashboards right out of the box, which makes this whole setup a breeze. For a deeper dive, you can also check out our guide on how to create reports from support tickets. This structured approach turns a confusing list of numbers into your best tool for continuous improvement.
Proven Strategies to Improve Your Key Metrics
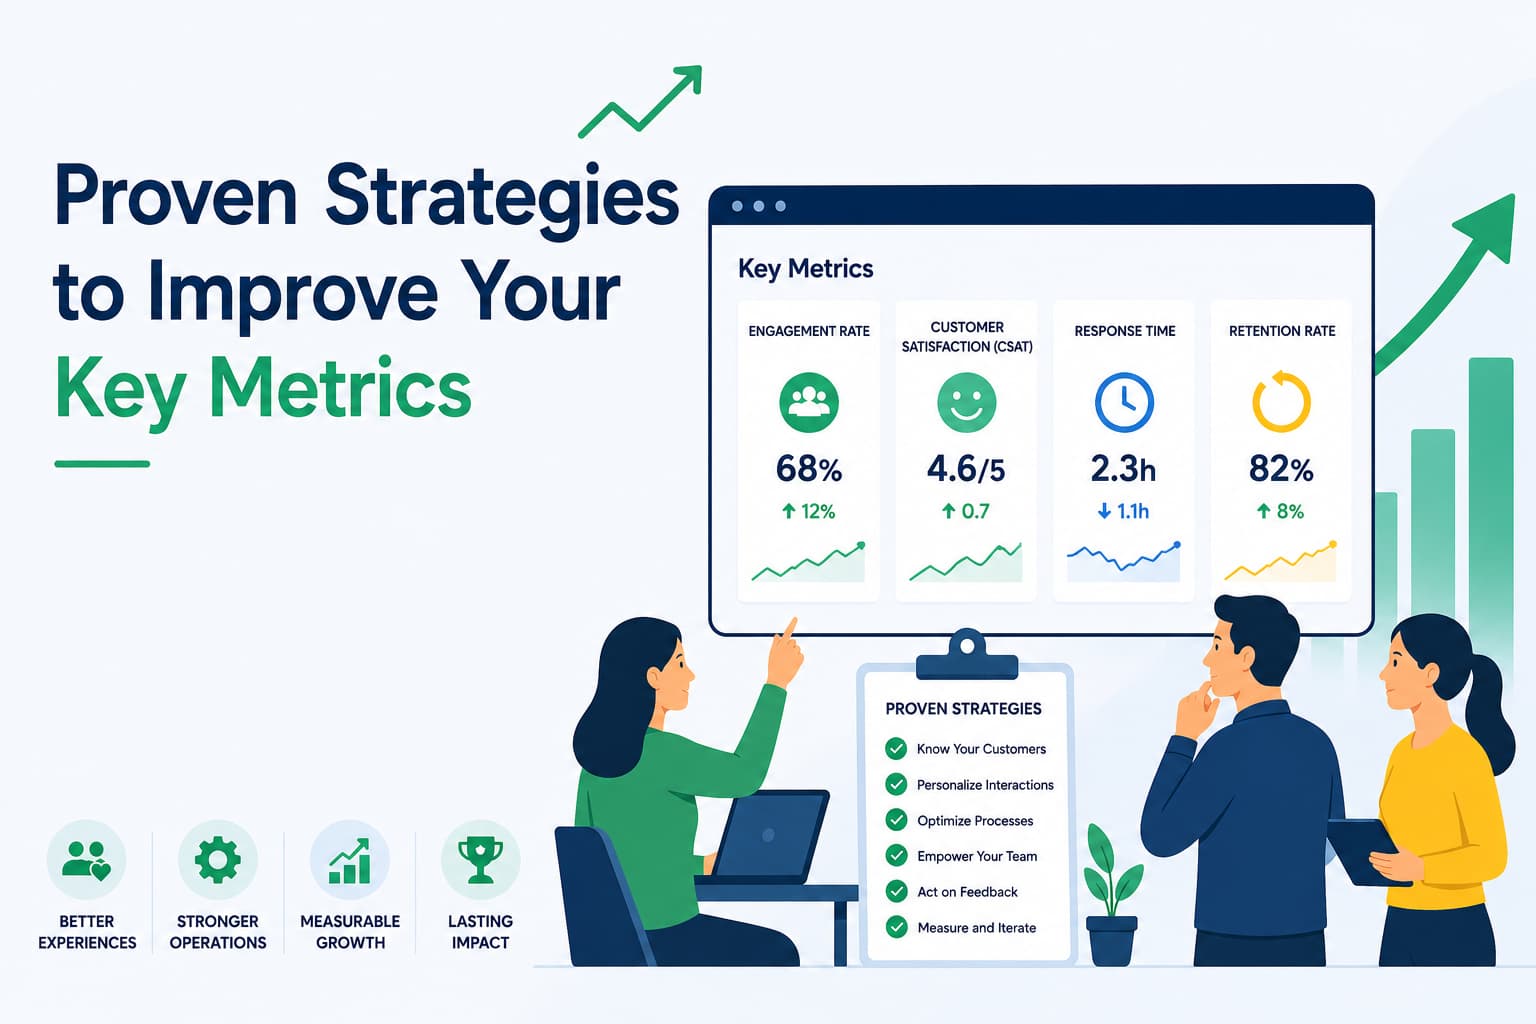
Knowing your customer engagement metrics is one thing, but actually improving them is where the real value is. Moving these numbers isn’t about chasing stats for a report; it’s about making real-world improvements to your customer experience and how your team operates.
Let’s dig into some of the most common problems support teams face and walk through concrete solutions you can start using today. Think of this as your playbook for turning data into action, with each strategy targeting a specific metric so you can see a measurable impact.
Boosting First Contact Resolution (FCR)
A low FCR rate is almost always a symptom of a knowledge gap. When your agents can’t find accurate information quickly, they’re forced to escalate tickets or leave customers hanging while they search for answers. This creates a clunky, high-effort experience that nobody enjoys.
The Problem: Agents constantly have to ask colleagues or managers for help, which balloons handle times and kills any chance of a one-touch resolution.
The Solution: The single best thing you can do is build and maintain a solid internal knowledge base. This creates a single source of truth that gives agents instant access to product details, troubleshooting guides, and company policies. A well-organized knowledge base is the backbone of any great support team.
A powerful knowledge base can slash agent ramp-up time by up to 35% and boost FCR by over 15% in just a few months. It effectively turns every agent into an expert, ensuring your customers get consistent and accurate help every time.
Tools like Ticketdesk AI take this a step further by weaving your knowledge base directly into the helpdesk. When a new ticket comes in, the AI instantly finds and suggests the most relevant articles, putting the solution right at your agent’s fingertips before they even have to search.
Slashing Average Handle Time (AHT)
If your AHT is creeping up, it’s a good bet that your agents are getting bogged down by manual, repetitive work. This could be anything from typing out the same welcome message over and over to manually tagging tickets or digging for customer details. All those little tasks add up, limiting how many customers an agent can help in a day.
The Problem: Agents are spending too much time on manual data entry and crafting replies to common questions, inflating AHT without adding any real value to the conversation.
The Solution: Bring in AI-powered reply suggestions and workflow automations. Instead of typing out another password reset email, agents can insert a pre-approved, AI-generated response with a single click.
Here are a few ways automation can make an immediate difference:
- Canned Responses: Build a library of answers for your most frequently asked questions.
- AI-Suggested Replies: Ticketdesk AI can analyze a customer’s question and draft a complete, context-aware response for the agent to quickly review and send.
- Automatic Triage: Let AI handle the sorting. It can automatically categorize and route tickets to the right team, saving precious minutes on every single ticket that comes in.
These tools don’t replace your agents; they free them up from the busywork. This gives them more time to focus on complex problem-solving and actually connecting with customers. To see exactly how this works, check out our guide on how to automate customer service with proven workflows.
Elevating Customer Satisfaction (CSAT)
A dip in your CSAT score is a flashing red light that you’re not meeting customer expectations. This is often tied directly to slow response times or inconsistent service. In today’s world, customers expect fast, helpful answers, and dropping the ball can quickly sour their perception of your brand.
The Problem: A growing backlog of technical or specialized questions is creating long wait times, leading to frustrated customers and tanking your CSAT scores.
The Solution: Use smart automation to make escalations and team communication seamless. For instance, instead of a support agent manually copying and pasting ticket details into a message for the engineering team, an AI-powered workflow can handle it instantly.
With a tool like Ticketdesk AI, you can set up a rule where any ticket tagged as a “bug report” gets automatically escalated. The system can summarize the issue and send it straight to the engineering team’s project management tool, cutting triage time by as much as 90%. This gets the problem in front of the right experts faster, leading to quicker fixes and happier customers who feel like you’re on their side.
Your Questions on Customer Engagement Metrics Answered
Diving into the world of support data brings up a lot of questions. As you start tracking customer engagement metrics, it’s totally normal to wonder about the best ways to measure, what “good” actually looks like, and where modern tools like AI fit in. Nailing this stuff down is how you build a measurement strategy that actually moves the needle.
We’ve tackled some of the most common questions support leaders ask right here. Our goal is to give you straightforward answers so you can move from just collecting data to using it with confidence.
How Often Should I Measure Customer Engagement Metrics?
The right rhythm for measurement isn’t one-size-fits-all; it really depends on what you’re looking at. Think of your metrics in three different speeds: real-time, weekly, and quarterly. Trying to watch everything all at once, every single day, is a surefire way to get lost in the noise.
Here’s a practical way to think about your monitoring schedule:
- Daily or Real-Time: These are your immediate, operational health metrics that belong on a live dashboard. This includes things like CSAT, First Contact Resolution (FCR), Ticket Backlog, and Average Handle Time (AHT). Watching these daily lets managers spot trouble as it happens and keep the team’s workflow smooth.
- Weekly: This cadence is perfect for reviewing team and individual performance trends without getting jumpy over small daily blips. It’s the ideal time to look at FCR and AHT by agent to see who might need a little coaching.
- Quarterly: The big-picture, relationship-building metrics like Net Promoter Score (NPS) are best measured quarterly. This gives you enough time to see real trends in customer loyalty without bugging your customers with constant surveys.
The most important thing is consistency. Using a platform that gives you both real-time dashboards for the daily grind and custom reports for bigger-picture planning is key to a balanced approach.
What Are Good Benchmarks for These Metrics?
It’s tempting to look for a magic number, but the most important benchmark you have is your own historical performance. Chasing a generic industry standard can be misleading because every business-and every customer base-is different.
Sure, you’ll hear that a CSAT score over 80% is considered strong, or that a SaaS company should shoot for an NPS above 50. These are useful signposts, but they shouldn’t be the final destination.
The most powerful benchmark is your own data from last month or last quarter. Your main goal should be continuous improvement-always striving to deliver a better experience for your customers. A great target is to improve your key metrics by 5-10% each quarter.
Focus on your own upward trend. This internal benchmarking makes sure you’re making progress that actually matters to your business, not just hitting some arbitrary external target. Your own data always tells the truest story.
How Can AI Improve Metrics Without Losing the Human Touch?
This is a huge-and important-question. The answer is to see AI not as a replacement for your team, but as their co-pilot. The best approach is to let AI handle the repetitive, time-sucking tasks, freeing up your agents for the work that requires real empathy and creative thinking.
Think of it like this: AI is incredible at handling high-volume, predictable questions.
- Automation for Speed: An AI agent can instantly resolve simple requests like password resets or “where is my order?” inquiries, 24/7. This crushes your first response times and gives CSAT a direct boost for those common, low-effort interactions.
- Empowerment for Quality: By taking the simple stuff off their plate, you give your human agents the time and mental bandwidth to dive into high-stakes customer issues. These are the complex, emotionally-charged conversations where true loyalty is built.
AI brings the speed and efficiency, while your team provides the irreplaceable human connection that builds real relationships. Platforms like Ticketdesk AI are built on this very idea, using automation to empower agents, not replace them. The result is a support operation that’s both incredibly efficient and deeply human.

Ready to get started?
Join hundreds of teams using Ticketdesk AI to deliver exceptional customer support.